

Table of contents
Quality and Regulatory Intelligence (QRI) allows life sciences companies to reduce compliance risk and improve product quality with analysis of regulatory updates and the corresponding agency enforcement actions.
In the life sciences industry, major players have employed Regulatory Intelligence for years, diligently tracking changes in the global regulatory landscape to maintain compliance and, increasingly, using it to create drug development strategies that save time and limit costs.
Many well-known providers, such as IQVIA, offer international regulatory intelligence solutions that they have developed over years. But until recently, none of this intelligence has included data about actual regulatory enforcement — that is, how regulators are actually interpreting and acting on regulations in real manufacturing facilities.
This is where Quality and Regulatory Intelligence — or QRI — comes in. QRI is an enhancement of traditional regulatory intelligence that adds an analysis of regulatory enforcement to help drug sponsors, CMOs, and medtech device manufacturers understand how regulations are executed in the real world.
A Quality and Regulatory Intelligence solution collects data about the actions of enforcement agencies, analyzes it, and develops an individualized risk profile to help manufacturers fully understand their own compliance risks for greater inspection readiness and better protect product quality.
Since agency enforcement focuses on current good practices — cGxP — in the life sciences and general pharmaceutical industries, Quality and Regulatory Intelligence does too. QRI is constantly updated with an evolving understanding of cGXP, including current Good Manufacturing Practices (cGMP), current Good Laboratory Practices (cGLP), Current Good Clinical Practices (cGCP), Current Good Documentation Practices (meeting the ALCOA standards), and more.
Why is QRI Crucial for the Life-Sciences Industry?
Forward-looking manufacturers embrace Quality and Regulatory Intelligence in order to:
- Reduce compliance risk by understanding the observations and actual violations that regulatory inspectors have uncovered in similar facilities, manufacturers can understand where their own Quality Management Systems may have weaknesses.
- Improve inspection readiness with knowledge of where regulatory agencies (and even specific inspectors) are finding deficiencies in other facilities, life-sciences manufacturers are able to keep their own sites prepared for the inevitable arrival of an inspector.
- Maintain product quality by helping to prevent certain deficiencies in the Quality Management System that can affect the safety or efficacy of the final product.
- Make regulatory surveillance easier and more effective by curating the most relevant regulatory developments and by making better sense of the global regulatory landscape beyond a single country.
Failing to contain compliance risk, improve inspection readiness, or maintain product quality can mean costly enforcement actions and the loss of product sales, as well as a diminished reputation in the life-sciences industry.
How do Life-Sciences Companies Collect and Analyze Quality and Regulatory Intelligence Data?
There are three main routes for collecting quality and regulatory intelligence data, with data analysis depending on the route:
- Using a national regulator’s online tools, such as the FDA Data Dashboard (read our post about how Redica Systems compares to the FDA Data Dashboard here)
- Requesting enforcement documents using FOIA, etc.
- Working with a Quality and Regulatory Intelligence service provider
Using a National Regulator’s Online Tools
In some countries, a national regulatory agency provides inspection statistics online, while fewer agencies provide enforcement data and documents through a database-linked tool. For example, Japan and Saudia Arabia provide statistics in annual, semi-annual, and other reports:
- Japanese Pharmaceuticals and Medical Devices Agency inspection data
- Saudi Food and Drug Authority inspection data
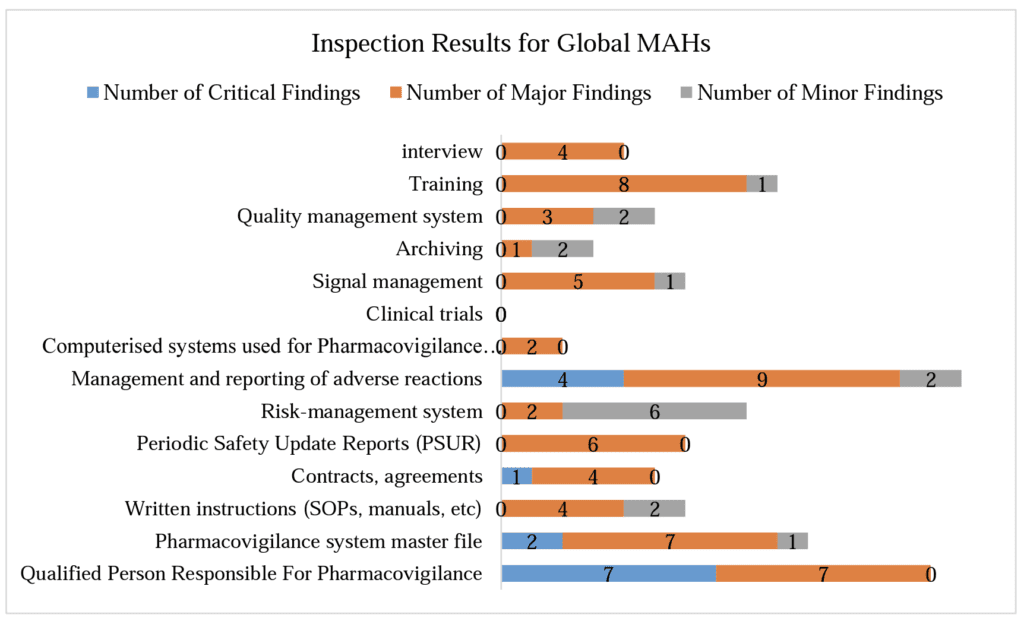
Figure 1 | Inspection Results for Global Marketing Authorisation Holders, from the Saudi Food and Drug Authority’s Mid-Annual PV Inspection Report 2023.
The FDA Data Dashboard is a good example of a set of tools provided online by a national regulator. It offers access to a large database of information on inspections, enforcement, and more. (Additional data are available from the CDER FOIA Electronic Reading Room, and the ORA FOIA Electronic Reading Room.)
The FDA Data Dashboard is split into several Compliance Dashboards: Inspections, Compliance Actions, Recalls, Imports Summary, Import Refusals, and Imports Entry.
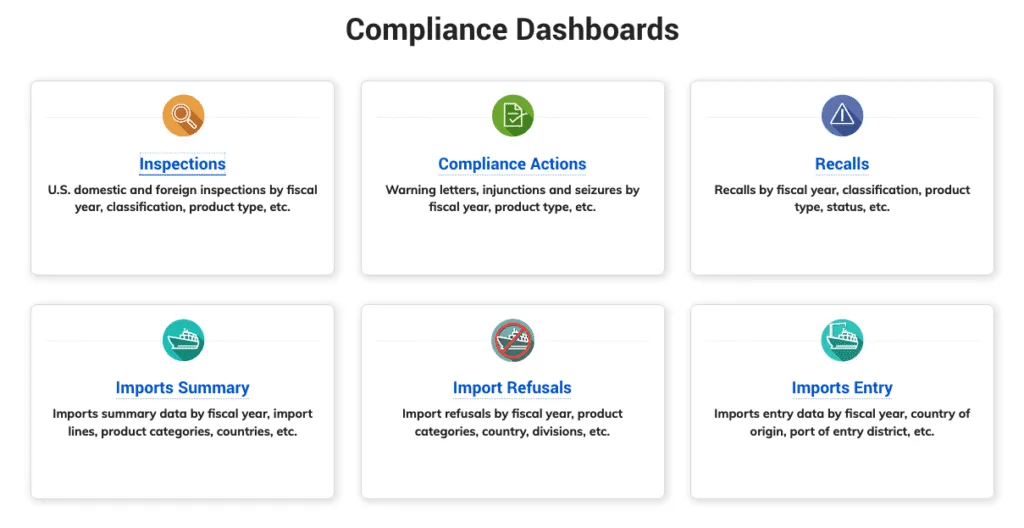
Figure 2 | Screenshot of the Compliance Dashboards available on the FDA Data Dashboard website.
The Quality and Regulatory Intelligence available through the FDA Data Dashboard’s Compliance Dashboards can prove useful for a wide variety of uses. For example, in the Inspections dashboard, users can view the number and types of inspections conducted by year; they can view the top 10 citations since 2009; and they can study the details of specific citations.
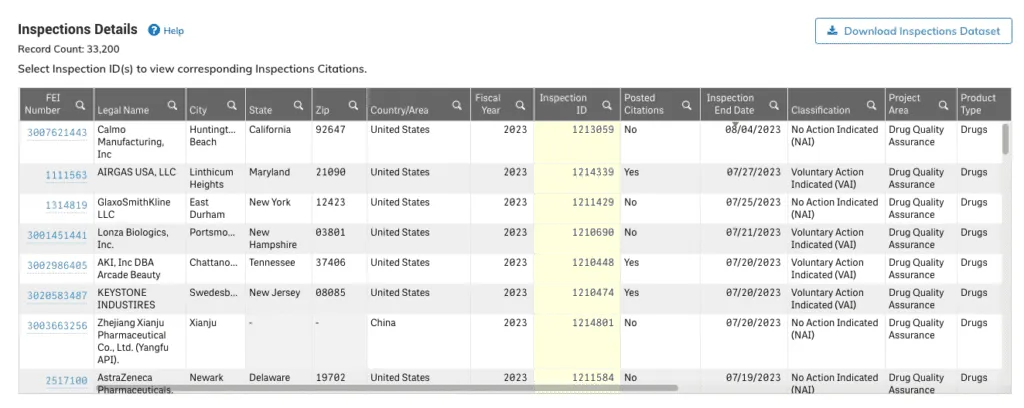
Figure 3 | Screenshot of Inspections Details available through the Inspections segment of the FDA Data Dashboard.
However, these databases have significant limitations:
- They provide only certain types of enforcement documents, leaving some types largely unrepresented, including state inspections, mutual recognition agreement (MRA)-related inspections, Good Clinical Practice (GCP) inspections, and more.
- They cannot provide sophisticated analysis or alerts. None of these tools can provide sophisticated trend queries or classification of observations and deficiencies — the FDA Data Dashboard allows only basic trend analysis, for example. Also, none of these can link documents based on a common characteristic — such as enforcement documents resulting from the same inspection.
- They provide documents within a limited time range, preventing the analysis of longer trends and the discovery of older records — for example, the FDA Data Dashboard does not provide documents from 2008 or earlier.
Collecting Enforcement Documents Using FOIA and Related Requests
Some firms may consider filing “Freedom of Information” requests — “Freedom of Information Act” (FOIA) requests in the United States.
This option is generally unnecessary for companies that work with a QRI services provider, which supplies such documents to clients. However, it can be suitable to others when specific Quality and Regulatory Intelligence is unavailable through online tools and is limited to a small number of documents.
Note: Before submitting a FOIA request to the FDA, check the agency’s Electronic Reading Room, which features an index of frequently requested FDA documents. Also, visit the FDA’s general Freedom of Information page, which offers FOIA reference materials, frequently asked questions, and more.
In the United States and other countries, “Freedom of Information” offices accept written requests that include detailed descriptions of the records sought, as well as information about the requestor. Most offices can fulfill specific requests more quickly than general requests that ask for “all information” about a subject, but each request can take weeks to months — or longer — to fulfill.
Each request requires a nominal fee, usually less than $100, and each request becomes public information.
Outside the United States, several other countries also provide a similar “Freedom of Information” process, although none is quite as transparent. By working with other countries’ “FOIA” offices, it is certainly possible to obtain useful enforcement documents, especially with highly specific requests.
Working with a Quality and Regulatory Intelligence Provider
To fill the gaps in the Quality and Regulatory Intelligence landscape, many life-sciences companies choose to work with a third-party company that specializes in building more complete databases and providing more sophisticated analysis.
For example, Redica Systems acquires thousands of pages of enforcement documents from the FDA going back to 2000, as well as from other agencies around the world, including the European Medicines Agency (EMA), the U.K. Medicines and Healthcare products Regulatory Agency (MHRA), Health Canada, and more.
The company also gathers documents from lesser-known U.S. sources, including Good Clinical Practice (GCP) inspections, mutual recognition agreement (MRA) inspections, state inspections, and more.
To allow sophisticated data analysis, the company retypes and “cleans” errors from enforcement documents to produce a massive, searchable text database.
Data organization begins with categorizing site deficiencies and inspector observations according to Redica Systems’s Quality System Labeling (QSL) model, which adds Data Integrity to the six familiar FDA-defined quality systems. The company further defines each deficiency and observation into subcategories two or three levels below the quality system.
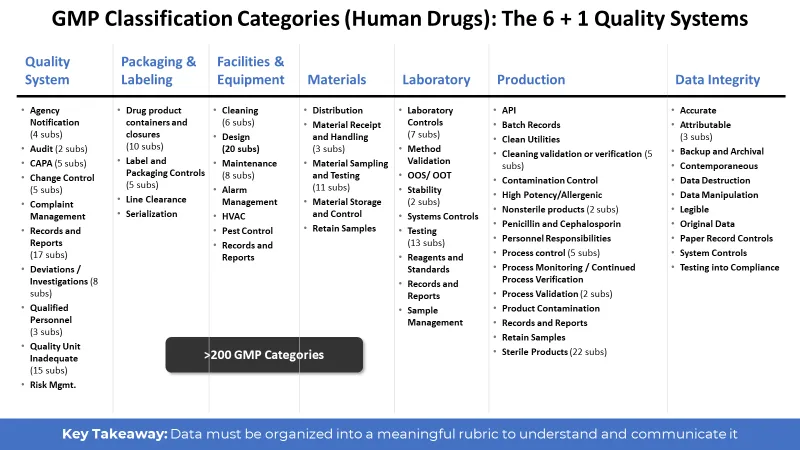
Figure 4 | The 6+1 Quality Systems classification scheme developed by Redica Systems.
Redica Systems also develops “family trees” for top pharmaceutical and medical technology companies based on the relationships among parent companies, subsidiaries, and suppliers.
Finally, the company rates and ranks the relative risk of each observation and deficiency — as well as other factors — using its Red Flag Model algorithm.
How do Life-Sciences Companies Use Trends and Insights to Maintain Product Quality and Reduce Compliance Risks?
Trends in enforcement data can reveal the direction regulatory agencies and enforcement activities are moving, while insights (from competitors, for example) can spotlight where potential issues might be found. Both are crucial products of Quality and Regulatory Intelligence that help life-sciences companies maintain product quality and reduce compliance risk.
When a trend results from investigators finding similar problems throughout portions of the industry, finding and correcting those issues can prevent damage to product quality — while also reducing the risk to compliance at an inspector’s next visit.
Similarly, using insights to understand the true dynamics behind an issue can point the way toward resolution.
For example, while Packaging and Labeling is often considered a weak link in the manufacturing chain, it accounted for only 13% of drug recalls between 2012 and 2021, according to data from Redica Systems. Instead, insights from that data revealed that drug recalls far more often resulted from issues in the Production (45%) and Quality (33%) systems.
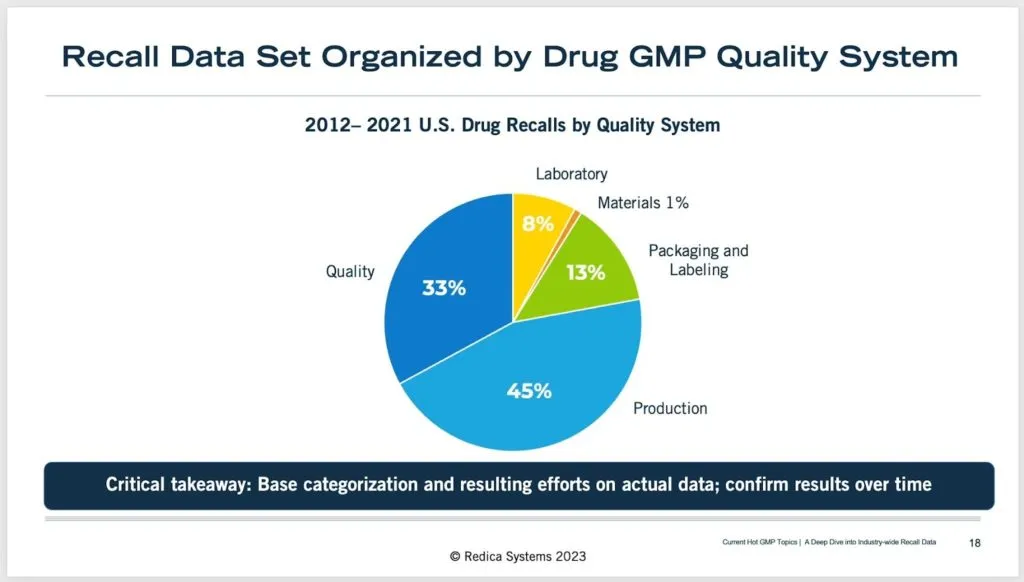
Figure 5 | Production and quality systems were most often linked to FDA drug recalls from 2012–2021, not packaging and labeling, according to Redica Systems data insights.
The emergence of Quality and Regulatory Intelligence has provided the life-sciences industry with a powerful new tool for protecting public health and safety while avoiding problems that can threaten compliance and product quality.
