The Workspace Where Intelligence Drives Action
The Redica App is the hub for connected intelligence, bringing regulatory, inspection, site, and post-market insights together in one collaborative workspace. Powered by Redica AI, teams can assess impact, coordinate decisions, and move faster with confidence.
Turning Intelligence Into Action
Teams often struggle to operationalize insights from regulatory updates, inspection findings, and quality signals. Information is stagnant across disconnected tools, email threads, spreadsheets, and reports, making it difficult to collaborate, assess impact, and document decisions. As risk signals increase and timelines shrink, teams need a shared space to interpret insights, align on next steps, and take action together.
The Redica App is the system of engagement for the Redica Intelligence Cloud. AI-assisted workflows, collaboration spaces, and explainable insights transform raw intelligence into coordinated, auditable action across teams and organizations.
One Workspace for Every Type of Intelligence
Contextualized Regulatory Intelligence
Review global regulatory changes, guidance updates, and standards directly in the Redica App. Teams can discuss relevance, assess impact to SOPs and processes, and document decisions collaboratively before routing actions downstream.
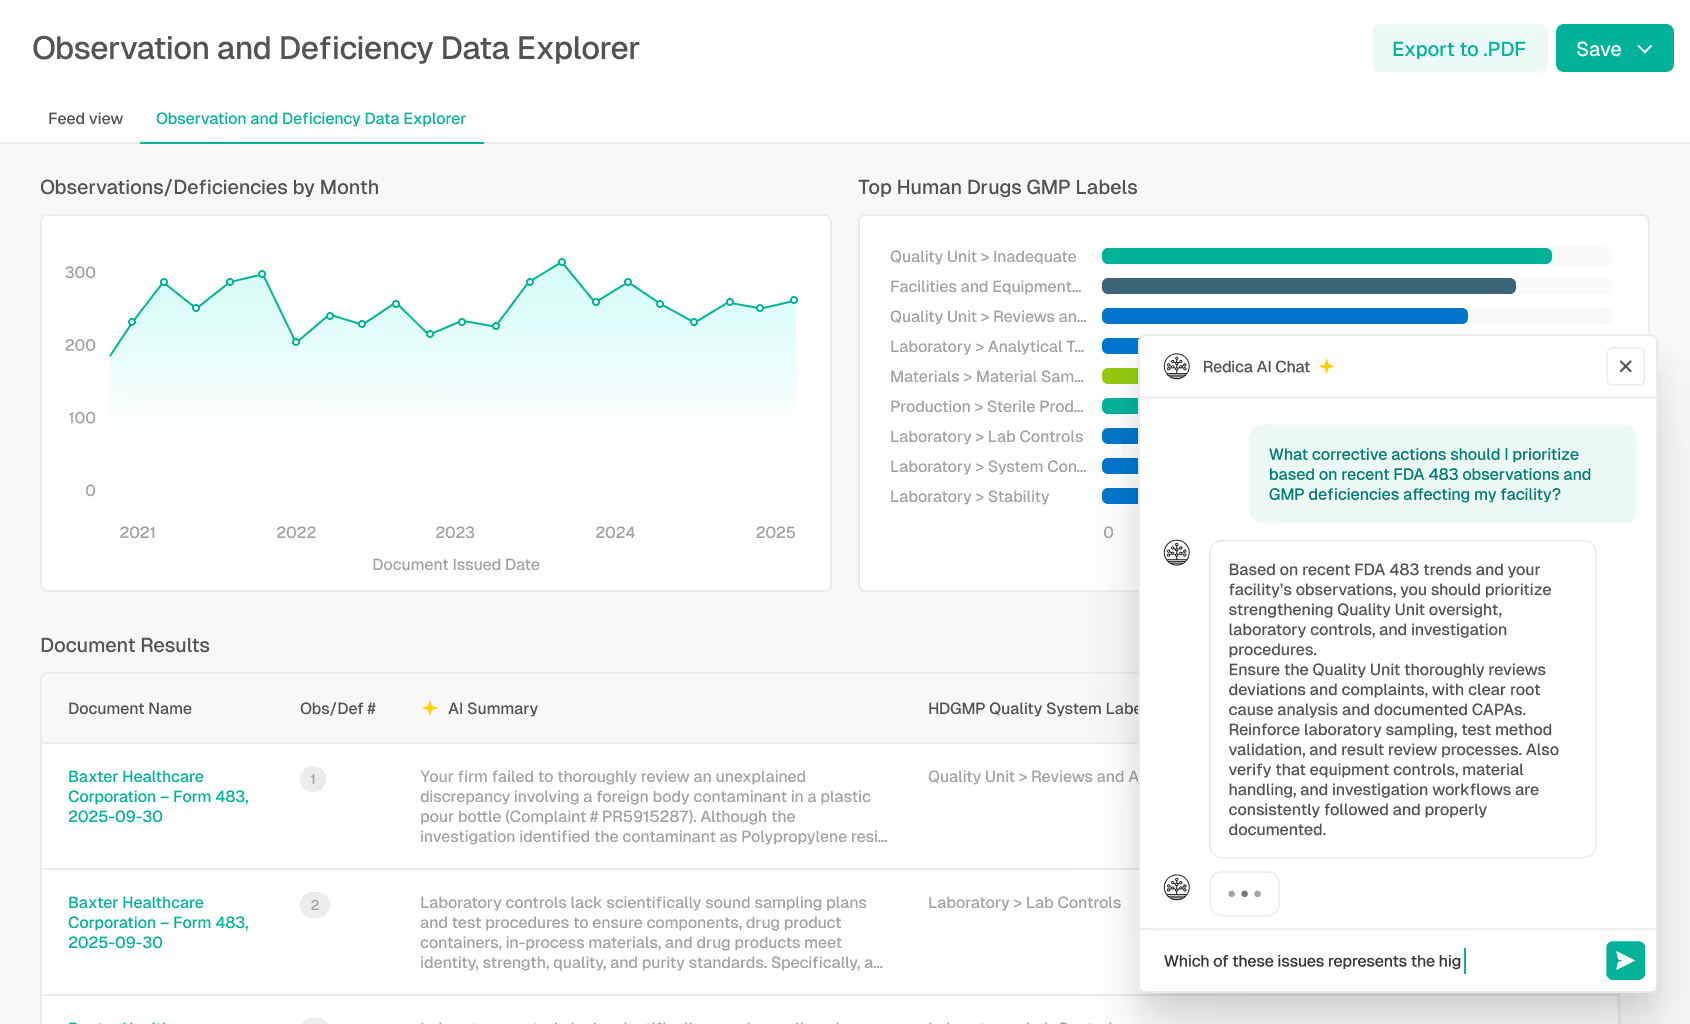
Smart Cards surface AI summaries and AI Change summaries on every signal, so teams can see updates, determine relevance, and assign actions directly on the feed.


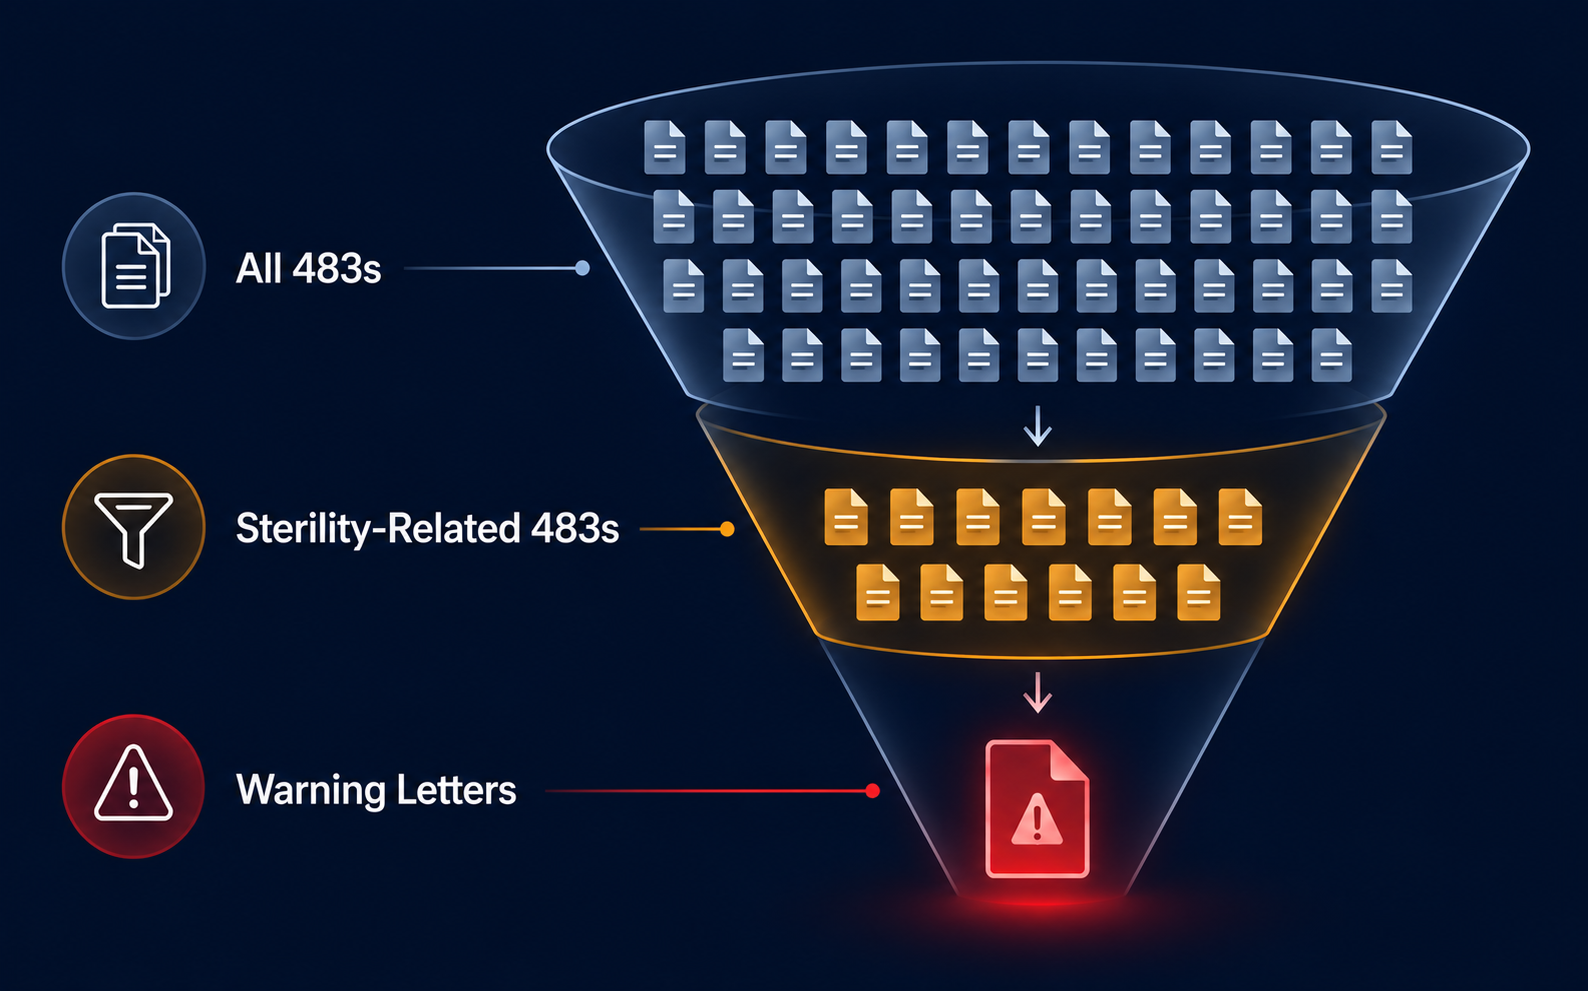
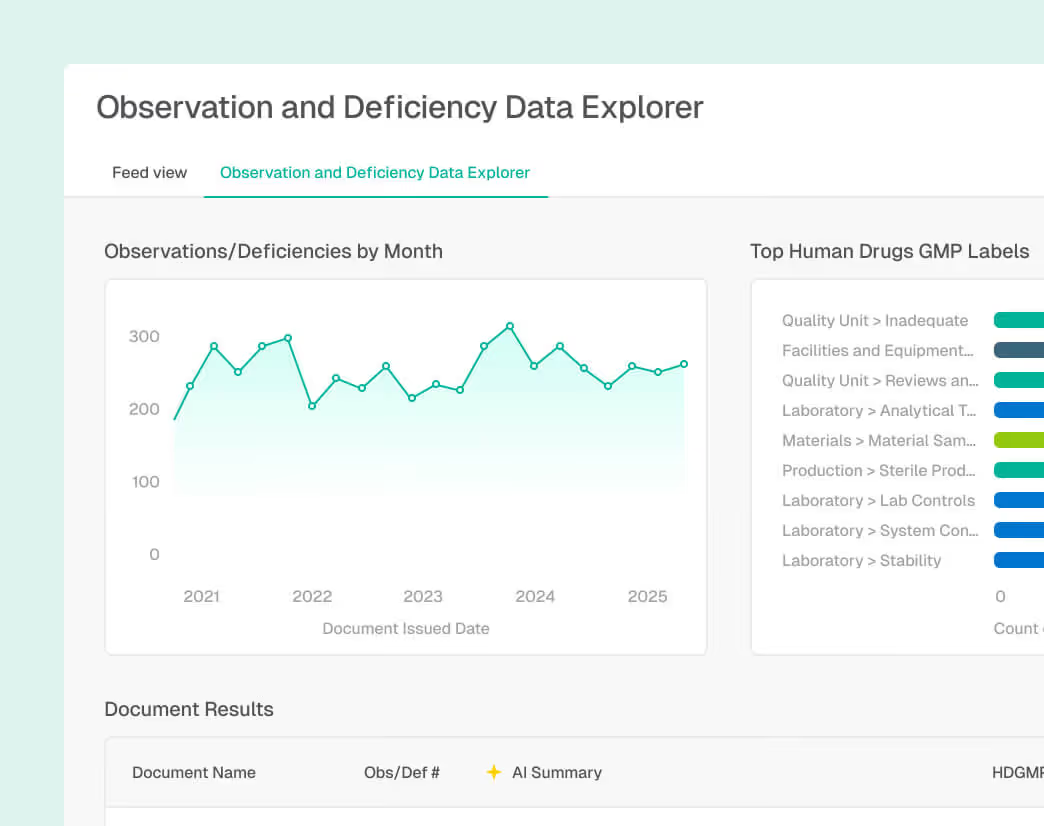
Inspection Intelligence in Action
Analyze inspection findings, enforcement trends, and regulator focus areas in shared Spaces. Quality and site teams can align on readiness priorities, assign follow-ups, and track decisions tied to inspection intelligence.
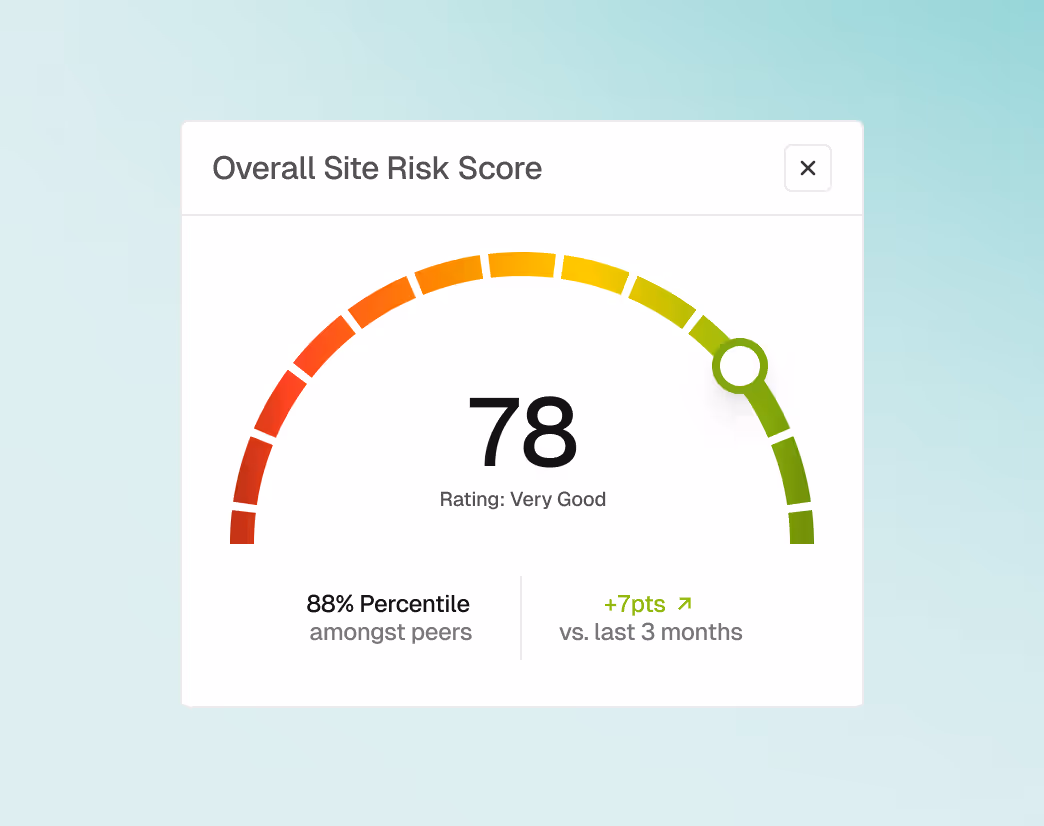
Site Intelligence for Risk Oversight
Use site and supplier intelligence to evaluate risk across CMOs, API manufacturers, and internal facilities. Cross-functional teams can review site profiles, compare risk signals, and coordinate oversight actions.
Connected Post-Market Intelligence
Bring post-market signals into the same workspace to understand how complaints, recalls, or safety trends intersect with regulatory and inspection context. Teams can collaborate on triage and escalation with shared visibility.
Collaboration Traceability and Integration
Across all four intelligence areas, the Redica App provides shared Spaces, AI-assisted summaries, and full traceability. Insights can stay in the app or flow into Veeva, QMS, ERP, and data platforms so insights and actions flow into downstream processes.

How Teams Use the Redica App Across Intelligence Types
Cross-Functional Impact Assessment
Smart Cards automatically enrich every regulatory signal in the feed with an AI-powered summary before teams even click in. Review regulatory, inspection, site, and post-market signals together, document interpretations, and align on actions in shared Spaces.
Inspection and Site Readiness Reviews
Bring Inspection Intelligence and Site Intelligence into a single session to prepare sites, evaluate suppliers, and track readiness decisions.
Risk and Escalation Coordination
Use Post-Market Intelligence alongside regulatory and enforcement context to support faster, better-informed escalation decisions.
The Redica App gives us a single place to review intelligence, collaborate across teams, and document decisions without chasing emails
Director, Global Quality Operations, Top 20 Pharma

The Collaboration Layer of the Redica Intelligence Cloud
Regulators, standards bodies, and trade associations monitored
Labels for faster filtering and data discovery
Global regulatory content ingestion & change detection
Connected version history for all new documents
Publish of core US regulatory signals
Refreshed sources annually for proactive, relevant change monitoring
Regulatory documents published monthly
FAQ
Can it integrate with our systems?
Yes. Redica delivers data and intelligence through the Redica app and via API for integrations with other solutions like Veeva RIM, Veeva Quality Docs, QMS, Snowflake, and document management systems.
Does it support AI explainability?
All AI-driven summaries are complete with data provenance, including source citations and reasoning steps for full audit traceability.
Does Redica provide enforcement intelligence alongside regulatory updates?
Yes. Redica uniquely unifies regulatory change with enforcement trends, citations, and inspection narratives for proactive risk forecasting.
How often is the data updated?
Continuously. Redica aggregates and enriches data from hundreds of global health authorities and standards bodies.
What makes Redica different from other monitoring tools?
Most systems surface new regulations. Redica tracks, classifies, and connects regulatory data by topic, industry, scope, product, and regulatory area, and seamlessly routes only contextually relevant rules, regulations, and guidance to you for impact assessment to your SOPs, products, and submissions so you can act immediately.
Still have questions? Contact us